S&P Sector Weighting – 19.87% for Technology
Price Action – Bullish overall with some warning signs of extension and potential for correction.
Technology is the highest weighted sector in the S&P 500 and has been among the best performing and leading sectors throughout the bull market.
From a technical standpoint the overall uptrend remains intact with the software and internet sectors leading the way and the networking and semiconductor sectors lagging behind. The long term uptrends remain the dominant underlying force at the moment but there are number of names showing signs of extension and a few names putting in lower highs in December vs the XLK. Overall the price action is considered to be bullish as there are few names breaking down below critical support levels at this time.
XLK – Technology
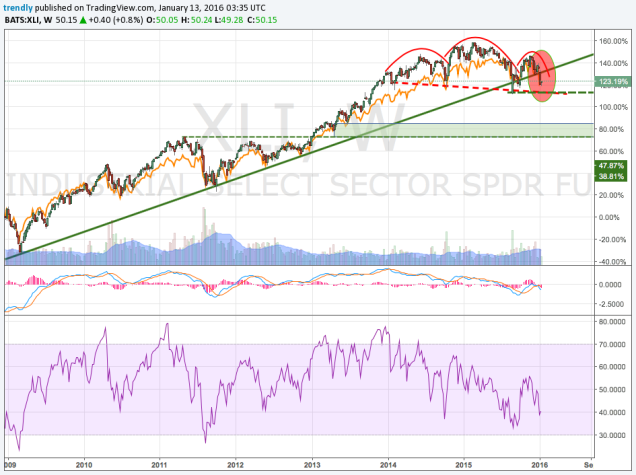
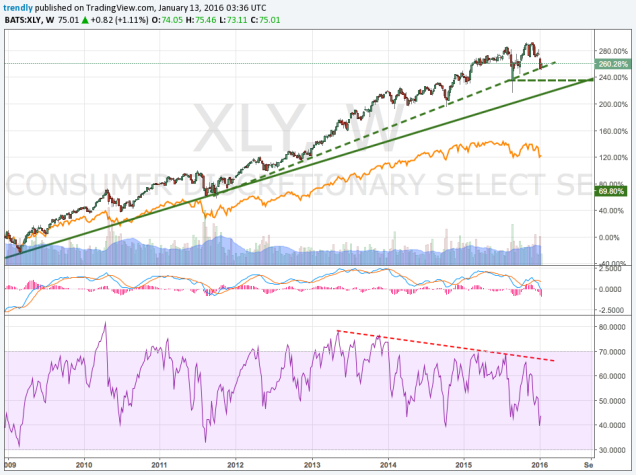
XLK Weekly Chart
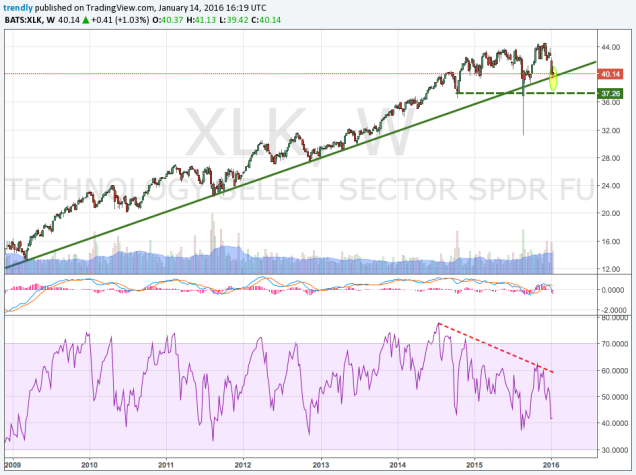
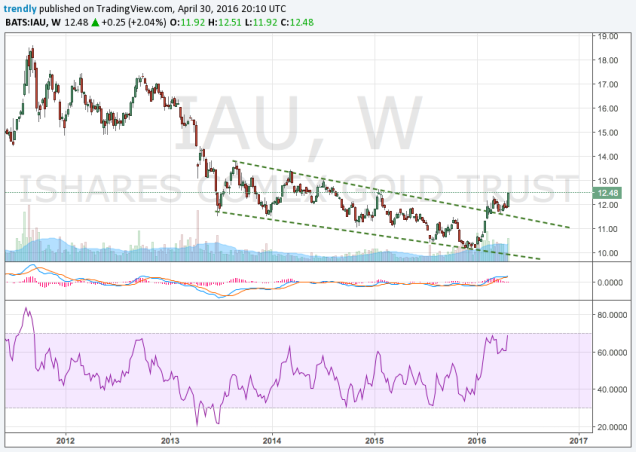
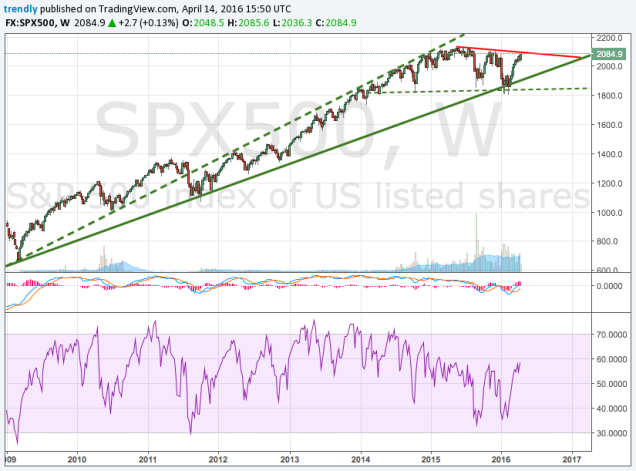
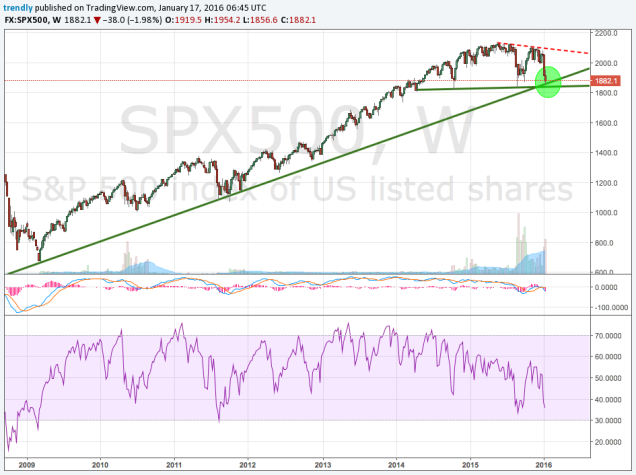
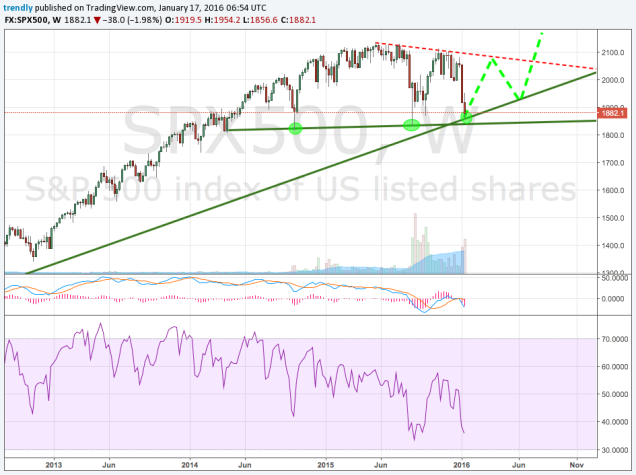
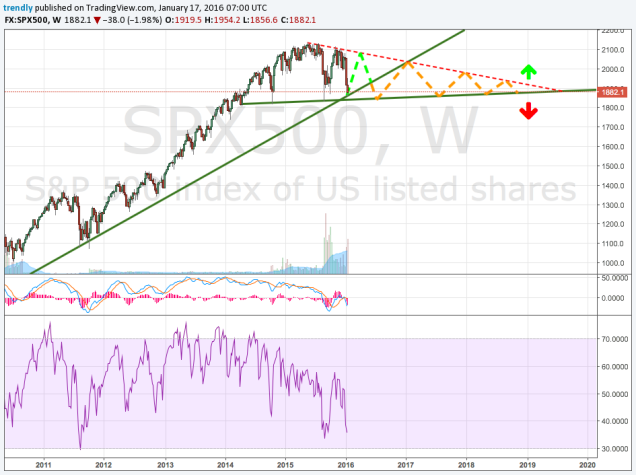
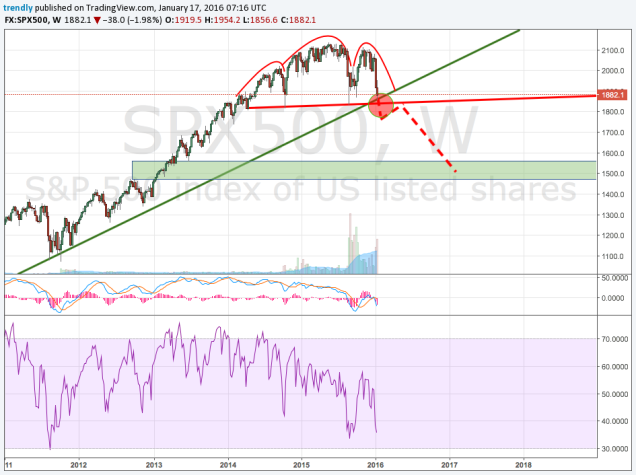
- TREND – the long term uptrend remains intact and dominant as we test the trend line from the 2009 lows.
- The August lows near $37 is key support.
- RSI did not confirm December highs suggesting the trend may be a bit extended and may need to correct/consolidate further.
Top Holdings – AAPL, MSFT, GOOGL, FB, T, VZ, V, CSCO, INTC
AAPL – Apple
XLK Weighting – 16.03%
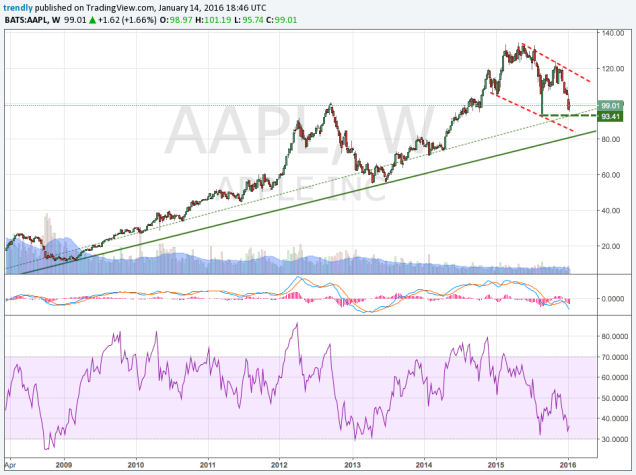
- TREND – the long term uptrend remains intact at this time. However the stock made a lower high in December and is now close to testing the August lows. This action appears so far as a healthy correction within a larger uptrend.
- AAPL made a lower high in December vs the XLK creating a bearish divergence from the broader index. While this is not an actionable observation at this point, AAPL is the highest weighted component of the index and should give investors caution. If AAPL breaks down further and an intermediate downtrend emerges, then the XLK is not far behind.
- The August lows near $93 is key support.
MSFT – Microsoft
XLK Weighting – 9.88%
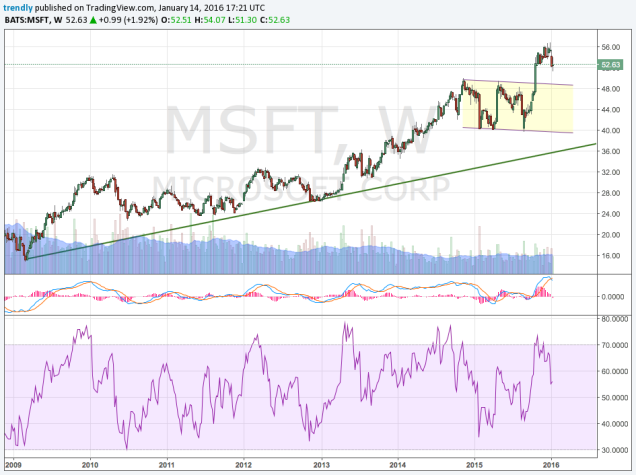
- TREND – the long term uptrend remains intact. The stock broke out of a bull flag in late 2015 and is holding at fresh highs. The upper boundary of the range should serve as interim support.
- MSFT has notable relative strength vs the sector.
FB – Facebook
XLK Weighting – 5.42%
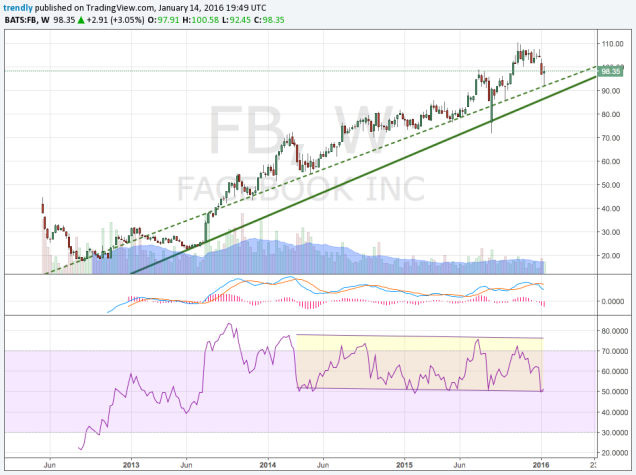
- TREND – the long term uptrend remains intact and healthy.
- The range in the RSI suggests sustainable upward momentum.
- FB is displaying notable relative strength vs the sector.
GOOGL – Alphabet Class A
XLK Weighting – 5.03%
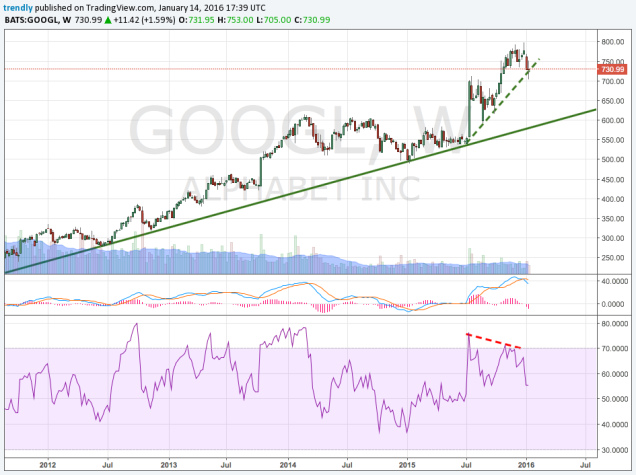
- TREND – the long term uptrend remains intact. The intermediate trend has accelerated to the upside after the July breakout. The RSI divergence at the December highs suggest a bit of near term extension, but the trend line from the breakout is holding as support and is the dominant near term force.
GOOG – Alphabet Class C
XLK Weighting – 4.95%
GOOG Daily Chart
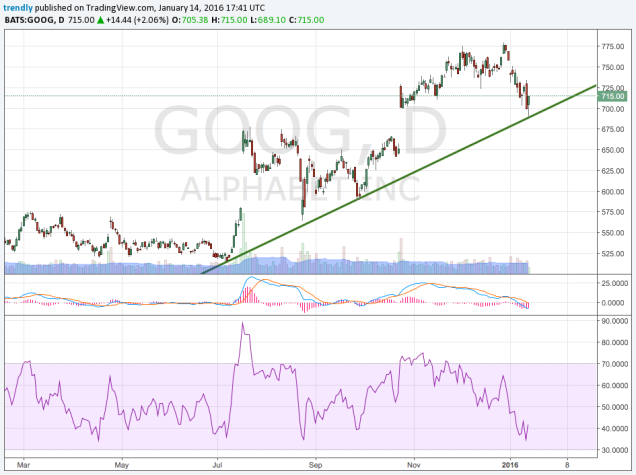
- TREND – The Class C shares are holding the same trend line as the Class A as shown on the daily chart.
T – AT&T
XLK Weighting – 4.80%
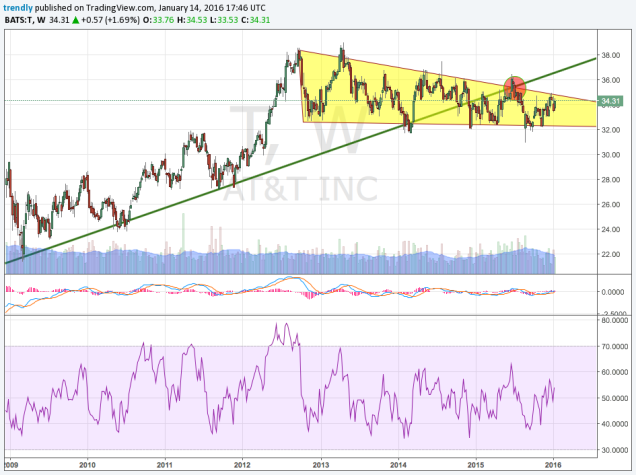
- TREND – the long term uptrend remains intact at this time. However, the trend line from the 2009 lows has been broken to the downside and confirmed as interim resistance.
- The stock has fallen into a descending triangle pattern with the $32 holding as support so far. These patterns tend to break to the downside as continued pressure on the lower boundary often give way as the pattern completes. However, this should be treated as a continuation pattern within the long term uptrend until we get a breakout or breakdown through the pattern. These narrowing range patterns are good option straddle plays as they have a limited time before pattern completes and price is forced to pick a direction. Also, as the range narrows volatility in the options chain compresses making the volatility premium cheaper, once the pattern breaks out the volatility component explodes as price breaks out/down.
VZ – Verizon
XLK Weighting – 4.44%
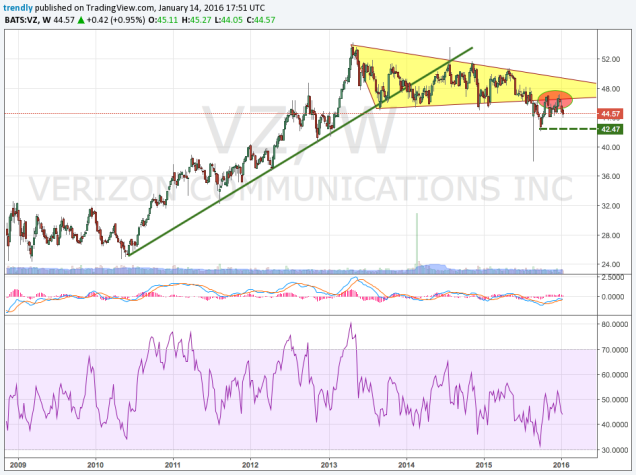
- TREND – the long term uptrend is in jeopardy and a clear intermediate downtrend has emerged. The stock has broken the descending triangle patten to the downside (similar pattern to its peer AT&T) and the lower boundary that was broken near $46 has been confirmed as resistance.
- Next support near $42.
V – Visa
XLK Weighting – 3.41%
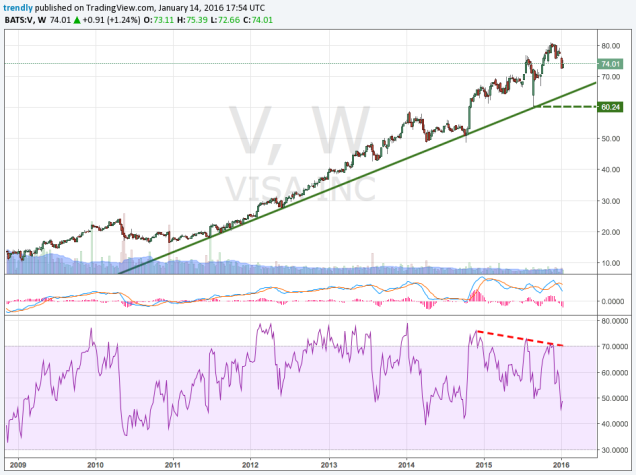
- TREND – the long term uptrend remains intact and persistent.
- The lower highs in the RSI suggests some extension in the trend.
- The August lows near $60 is key support.
- High relative strength vs XLK.
CSCO – Cisco
XLK Weighting – 3.4%
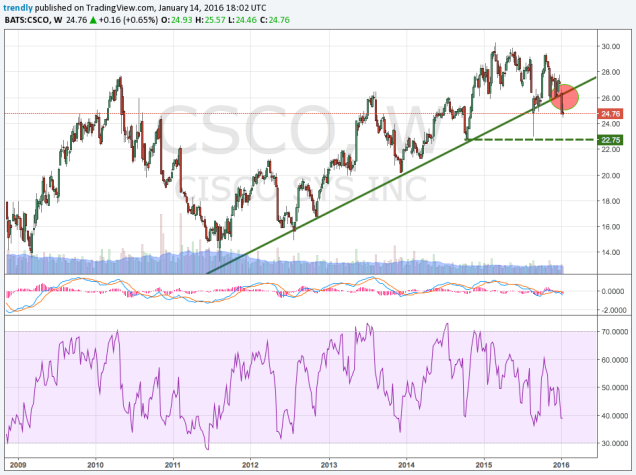
- TREND – the long term uptrend remains intact at this time. However, the uptrend line from the 2012 lows has been penetrated to the downside.
- The 2014 lows near $23 is key support to the long term trend.
INTC – Intel
XLK Weighting – 3.21%
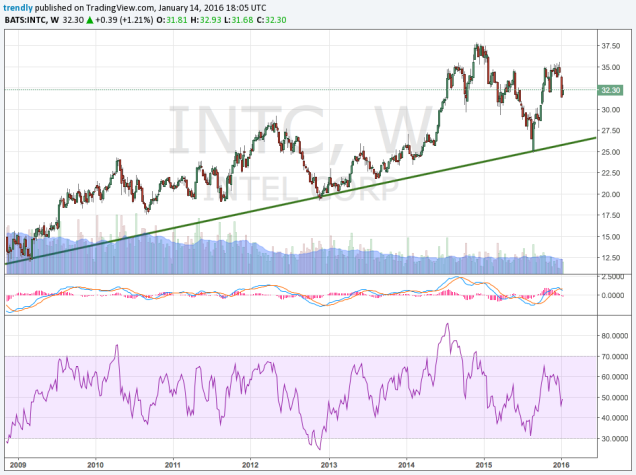
- TREND – the long term uptrend remains intact and healthy.
SOX – PHLX Semiconductor Index
Top Holdings – INTC, TXN, QCOM, AVGO, TSM, SNDK, NVDA, ADI, AMAT, MU
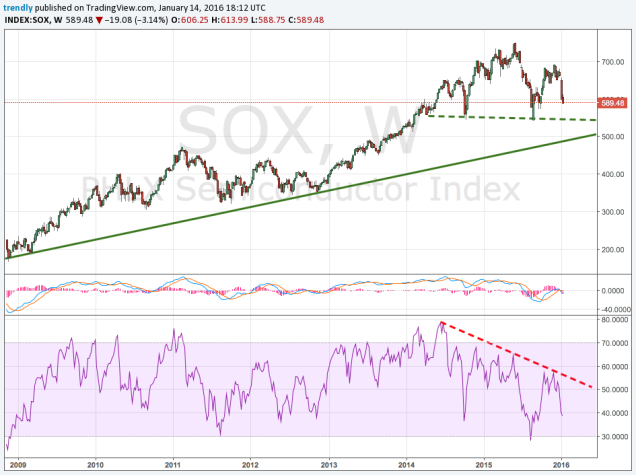
- TREND – the long term uptrend remains intact at this time.
- The SOX made a lower high in December vs the XLK.
- The August lows near $540 is key support.
IGV – iShares Software
Top Holdings – MSFT, ADBE CRM, ORCL, INTU, ERTS, ATVI, RHT, SYMC, CTXS
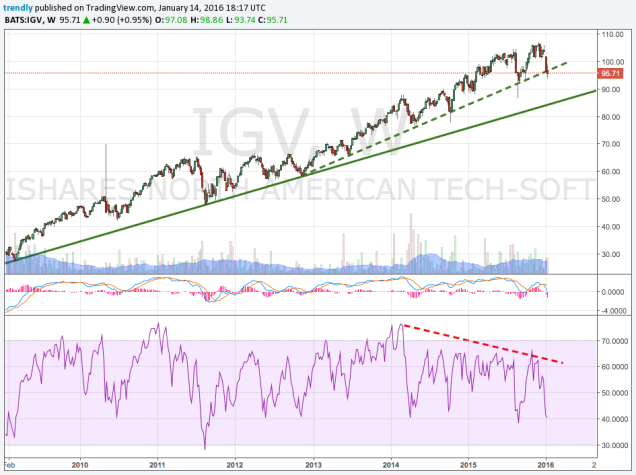
- TREND – the long term uptrend remains intact. The uptrend from the 2012 lows is holding.
- Software is displaying high relative strength vs the XLK and has been a leading subsection of the technology space.
- RSI suggests a bit of extension but the intermediate uptrend remains dominant at this time.
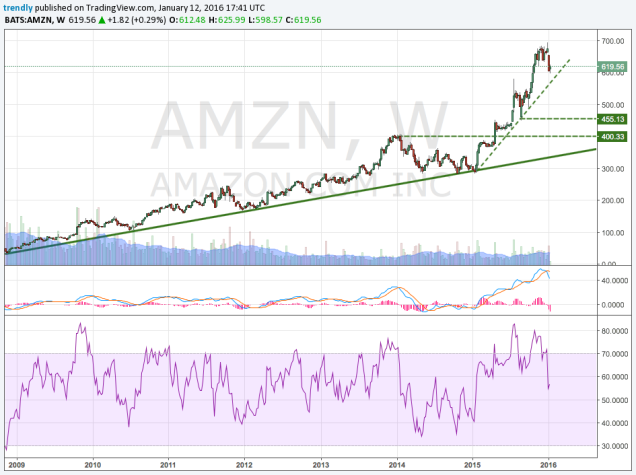
FDN – Dow Jones Internet
Top Holdings – AMZN, GOOGL, FB, CRM, NFLX, PYPL, LNKD, EBAY, YHOO
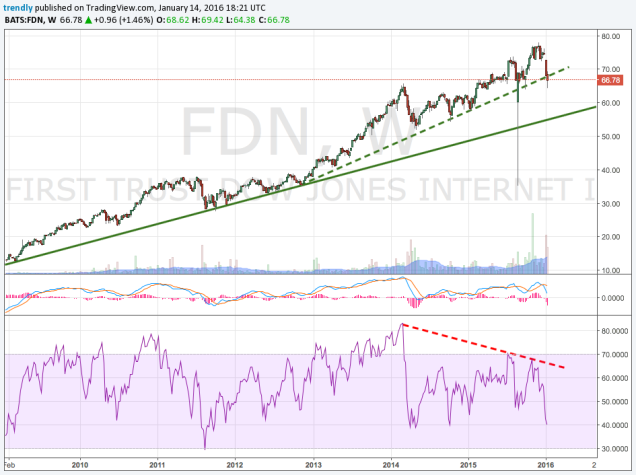
- TREND – the long term uptrend remains intact. The uptrend line from the 2012 lows is holding.
- High relative strength vs XLK. Internet has been a leading sub sector in technology.
- RSI suggests a bit of extension at recent highs, but uptrend is dominant at this point.
IGN – iShares Networking
Top Holdings – QCOM, CSCO, HRS, MOT, PANW, JNPR, CIEN, ARRS, BRCD, VSAT
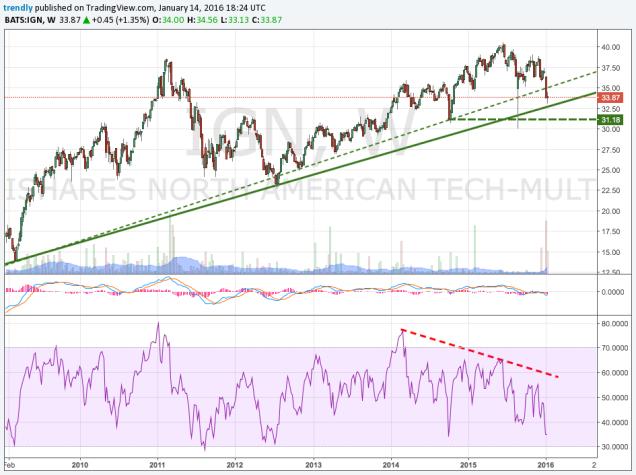
- TREND – the long term uptrend remains intact at this time.
- IGN made a lower high vs XLK in December.
- $31 is key long term trend support.
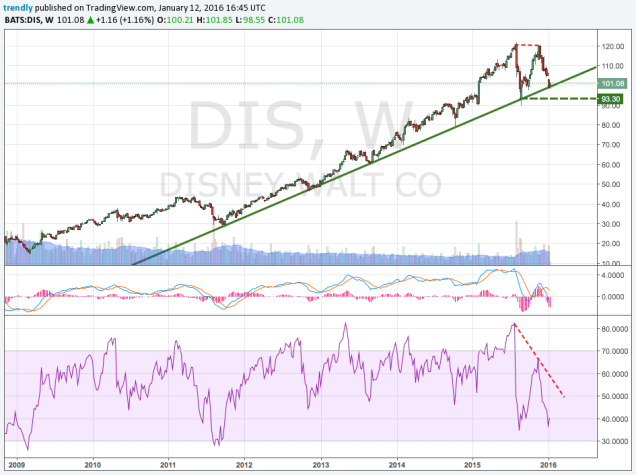
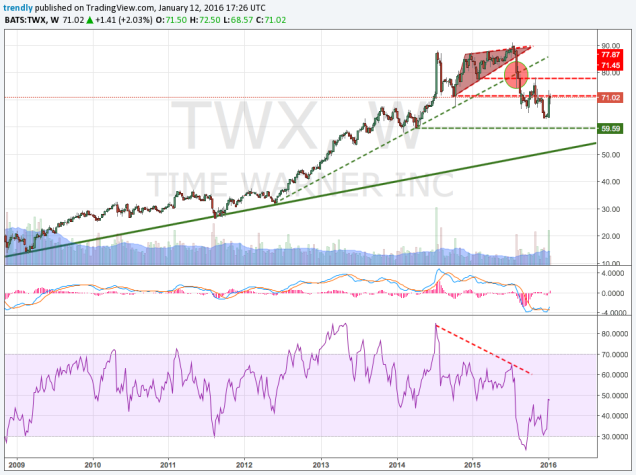
PBS – Powershares Media
Top Holdings – FB, GOOGL, DIS, FOX, SIRI, DISH,TWX, GTN
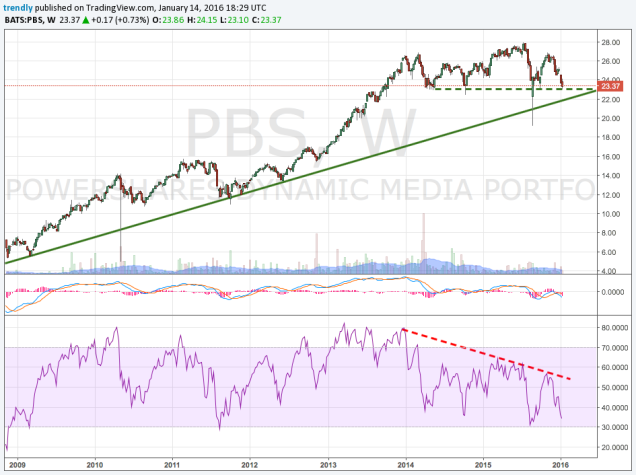
- TREND – the long term uptrend remain intact at this time. The shares are now testing the lower boundary of a 2.5 year range as the long term trend line approaches.